
"The influence of rider:horse bodyweight ratio and rider‐horse‐saddle fit on equine gait and behaviour: A pilot study" by S. Dyson, A. D. Ellis, R. Mackechnie‐Guire, J. Douglas, A. Bondi and P. Harris
The effect of rider weight on equine welfare and performance requires further investigation. The objective of this prospective, cross‐over, randomised trial was to assess gait and behavioural responses of horses to riders of similar ability, but different bodyweights.
Six nonlame horses in regular work were ridden by each of four riders: Light (L), Moderate (M), Heavy (H) and Very Heavy (VH). Saddle fit was assessed subjectively throughout the study.
Each horse was ridden twice by riders L and M, and once by rider H. Rider VH rode five horses once and one twice. Each horse‐rider combination undertook a standardised, 30‐min ‘dressage‐test' which was abandoned if we observed lameness grade ≥ 3/8 in one limb, grade ≥ 2/8 in ≥ 2 limbs, or ≥ 10/24 behavioural markers of pain.
Horses were reassessed in hand 45–60 min after any abandonment. Mean rider bodyweights, body mass index (BMI) values and rider:horse bodyweight percentages for the L, M, H and VH riders were respectively: 60.8, 77.8, 91.0, 142.1 kg; 23.2, 28.0, 26.3, 46.9 kg/m2; 10.0–11.7%, 12.8–15.0%, 15.3–17.9%, 23.6–27.5%. All 13 H and VH rider tests (lameness, n = 12; behaviour, n = 1) and one of 12 M rider tests (lameness) were abandoned.
Lameness was confirmed using inertial measurement unit data. All horses trotted sound after test abandonment and completed the study moving well when ridden. Limitations of the study were saddle fit was not ideal in all horse‐rider combinations and abandonment criteria were subjective.
The conclusions and clinical relevance of the study were that large riders can induce temporary lameness and behaviours consistent with musculoskeletal pain. This may relate to rider bodyweight and/or weight distribution. Riders M and H had similar BMI but markedly different test abandonment rates, therefore bodyweight is likely to be more relevant than BMI.
Further work is required to determine if horse fitness, adaptation to heavier weights and better saddle fit for heavier/taller riders will increase horses' weight‐carrying capacity.
Introduction
As the human population gets heavier (Reilly and Dorosty 1999; Rennie and Jebb 2005; Han et al. 2015; Wang et al. 2017), there has been growing debate about relative rider‐horse sizes.
This was highlighted as a research priority at the 2nd International Saddle Research Trust Workshop (Clayton et al. 2015). In 2015, World Horse Welfare, in conjunction with the British Equestrian Federation, hosted a meeting attended by senior representatives from the UK equine industry.
It was concluded that ‘innovative ways should be developed, so that riders can assess if they are the correct weight for their horse, explore preriding fitness initiatives and also develop guidance to support judges and officials to ensure that the horses' welfare always remains paramount' (World Horse Welfare 2015).
Studies investigating rider weight have been performed (Sloet van Oldruitenborgh‐Oosterbaan et al. 1995; Powell et al. 2008; Matsuura et al. 2013a,2013b, 2016; Gunnarsson et al. 2017; Stefánsdóttir et al. 2017), but few have satisfactorily addressed this issue in a typical riding situation.
They have, for example, utilised lead weights to alter the total load carried (Matsuura et al. 2013a,2013b, 2016; Gunnarsson et al. 2017), which does not address potential differences in physique and balance in riders of differing weights, or treadmill exercise (Sloet van Oldruitenborgh‐Oosterbaan et al. 1995), which does not necessarily equate with overground exercise, and does not include turns and circles.
In addition, several have utilised very high total load:horse bodyweight ratios (Matsuura et al. 2013a,2013b, 2016; Gunnarsson et al. 2017; Stefánsdóttir et al. 2017), so we do not know whether changes in equine performance may occur at lower rider:horse bodyweight ratios.
Therefore, although it is widely recognised that inappropriate rider size has welfare implications for horses (Clayton et al. 2015), there is a lack of reliable scientific evidence on which to base guidelines.
This is a multifactorial issue with many inter‐related aspects, including the horse's age, its fitness and muscle development, thoracolumbar length and the presence or absence of lameness; the type, speed and duration of work; the rider's skill, fitness, balance and coordination; the ability of the rider to sit straight; the fit of the saddle to both the horse and rider; and the terrain over which the horse is ridden (Clayton et al. 2015).
Lameness may be present in ridden horses that is not detectable in hand or on the lunge (Licka et al. 2004; Greve and Dyson 2014; Dyson and Greve 2016).
Moreover, we have observed that a heavy rider may transiently induce lameness in a horse that was not lame when ridden immediately previously by a lighter rider, and that lameness may be exacerbated in a lame horse ridden by a heavy rider compared with a lighter rider (S. Dyson, unpublished data).
In addition, it has recently been shown that, during ridden exercise, lame horses may show behavioural differences compared with nonlame horses (Dyson et al. 2017, 2018a). Application of a ridden horse ethogram has demonstrated an association between the presence of ≥8/24 behavioural markers and musculoskeletal pain (Dyson et al. 2018a) and a reduction in the number of markers after resolution of lameness by diagnostic analgesia (Dyson and Van Dijk 2018; Dyson et al. 2018b).
The aim of this investigation was to assess gait and behavioural responses in typical nonelite competition riding horses undergoing a standardised exercise test, when ridden by four riders of similar ability but different bodyweights.
The study design mimicked the situation that occurs in many riding establishments and equestrian disciplines in which a horse or pony may be ridden in its usual saddle by riders of varying weights and body shapes.
Materials and methods
The study was approved by the Clinical Ethical Review Committee of the Animal Health Trust (AHT 28 2016). The horse owners gave informed consent for inclusion of their horses in the study.
Study riders
There were four riders of similar ability (Williams and Tabor 2017) but differing bodyweights, assessed by British Horse Society (BHS) Instructors prior to selection (S.D.) and during the study (A.B.) using the (Fédération Equestre Internationale 2017) 0–10 scale for riders:
Light (L: K.S.) – a BHS Intermediate Instructor and experienced rider, with >25 years of professional riding experience, who had competed in British Eventing to Intermediate level and to Advanced Medium in British Dressage (BD), and who was currently an equine technician at the Animal Health Trust (AHT);
Moderate (M: S.G.) – an experienced rider with 5 years of professional riding experience who had competed to Medium level in BD and was currently an equine technician at the AHT;
Heavy (H: T.T.) – a BHS Instructor with >25 years of professional riding experience; Very Heavy (VH: K.A.) – an experienced rider for >25 years. All riders were accustomed to riding a variety of horses and were riding daily. The riders' ages were 49, 26, 56 and 36 years respectively.
Horses
All horses were volunteered by their owners. Eight horses (six test horses [designated Horses 1–6; Warmbloods, n = 3; cob‐type, n = 2; Lusitano, n = 1] and two reserve horses [Irish Sports Horse and Thoroughbred]) were selected from 24 evaluated based on the absence of forelimb lameness or hindlimb lameness grade >1/8 (Dyson 2011).
All horses were evaluated by a Royal College of Veterinary Surgeons Specialist in Equine Orthopaedics (S.D.), specifically for the study, 6–8 weeks before the start of the study in hand at walk and trot and ridden by their usual rider in walk, trot (including 20 and 10 m diameter circles) and canter. There was no detectable lameness in seven horses; one horse had episodic grade 1/8 left hindlimb lameness when ridden.
Horses were selected based on a bodyweight category of 500–600 kg so that, during the study, the rider:horse bodyweight percentages would be 10–12 (L), >12 ≤ 15 (M), >15 < 18 (H) and >20 (VH). The owners considered that their horses were capable of being ridden ‘on the bit' for 30 min, predominantly in trot and canter, twice daily.
At the time of selection, the horses' body condition scores (BCS) ranged from 5.0 to 7.0 (1.0–9.0 scale; Henneke et al. 1983). The owners, who were less experienced than the test riders, provided estimates of their own height and bodyweight.
Saddle fit
The saddle fit for each horse was assessed by a Master Saddle Fitters Consultant (C.M.) and adjustments were made to improve fit when required, in order to minimise the risk of a horse entering the study with pre‐existing thoracolumbar pain.
On the day prior to commencement of the study, the saddle fit was rechecked (C.M.) and further adjustments were made if necessary. On all days throughout the study, saddle fit was rechecked for each horse and abnormalities of fit were recorded.
The day prior to commencement of the study
The horses were stabled at World Horse Welfare. All horses were assessed moving in hand in straight lines at trot on a hard surface by S.D. and the presence of lameness was graded and recorded (0–8; Dyson 2011). One horse was rejected because of grade 4/8 right hindlimb lameness.
All horses were ridden in the indoor arena by their usual rider (n = 5) or rider L (one test horse and one reserve horse) to familiarise them with the study test environment.
Measurements of the riders, horses and tack prior to the study are detailed in Table 1 and (Supplementary Items 1–3) and the results are presented in Table 2 and Supplementary Item.
The study days
Horse and rider weights
On each study day, the horses were weighed at 07:00 hours and the riders were weighed, wearing their riding equipment, at 08:00 hours.
Objective gait assessment methodology
Five MTw (2nd generation) inertial measurement units (IMUs)
1
Xsens, Enschede, The Netherlands. in custom‐built pouches were attached using double‐sided or hook and loop tape (IMU central position was marked with white correction fluid on hair for future consistency of positioning) in the following positions: left and right tubera coxae; between the tubera sacrale (‘pelvis'); dorsal aspect of the withers; bridle headpiece on the midline (‘poll'). Data were synchronised to a wireless transmitter/receiver
2 Awinda, Xsens, Enschede, The Netherlands. attached via USB to a laptop computer. Data were processed at an internal sample rate of 1000 Hz (from raw data to orientation) and sent wirelessly from each sensor to the laptop computer running MTManager software
1
Xsens, Enschede, The Netherlands. at an update rate of 60 Hz. Custom‐written MATLAB scripts
3
The Mathworks Inc., Natick, Massachusetts, USA. were used for stride segmentation (Starke et al. , as well as for filtering, rotation from a sensor to a horse/gravity‐based reference frame and double integration to vertical displacement (Warner et al. ). For each stride, movement asymmetry values at the pelvis (pelvis Minimum Difference [PMnD], pelvis Maximum Difference [PMxD]), poll (PollMnD, PollMxD), withers (WMnD, WMxD) and tubera coxae (Hip Hike Difference [HHD]) were calculated based on previously published definitions (Pfau et al. 2018).
Procedures prior to each ridden test
Each horse trotted in hand in a straight line for approximately 40 m twice on the arena surface, and IMU recordings were acquired (RG, TP, ES). The gait was simultaneously assessed subjectively (S.D.).
A force mat,4 Pliance®, Novel GmbH, Munich, Germany. the saddle and saddle pads were placed on the horse. To facilitate assessment of saddle movement relative to the horse, a strip of fluorescent tape was stuck to the horse's dorsal midline immediately cranial to the tail head and two pieces of tape were placed on the caudal aspect of the cantle of the saddle, one aligned vertically in a central location, the second aligned horizontally.
The rider mounted from a purpose‐designed mounting block (maximum height, 103 cm; second step, 69 cm) to minimise disturbance of the force mat. The saddle fit to horse and rider was subjectively assessed (A.B.). A lateral photograph of the horse standing in front of a 100 cm line on the wall was acquired to record rider position in the saddle.
The riders wore snug‐fitting black tops, with a green cross on the back comprising a midline vertical line and a horizontal line at armpit level.
5
Visualise Technical Sportswear, Moreton Morrell, Warwick, UK.
The test programme
The predefined, 30‐min test (Supplementary Item ), with which the riders were familiar, was performed in a 20 × 60 m marked arena. It included walk, rising trot and canter on both reins.
The test was called by RY, who also checked that, in trot, the rider sat on the correct diagonal (i.e. when the outside forelimb and inside hindlimb were bearing weight).
Objective gait assessment
Inertial measurement units data were collected with the horse moving in straight lines (2 × 60 m) and circles on both the left and right reins during the first and second trot periods (Supplementary Item ) of each individual horse:rider test.
Subjective assessments
Subjective assessment of gait was performed continuously throughout the test by S.D. The presence and grade (0–8) of lameness in walk and trot were recorded for each test movement. The presence of 24 behavioural markers (Dyson et al. 2018a; Supplementary Item ) were recorded continuously.
The assessor stood between C and H and between C and M, for work performed on the left and right reins respectively. The ridden horse ethogram was also applied retrospectively to video recordings of all horse‐rider combinations for predetermined parts of the test. The results are presented elsewhere (Dyson et al. 2018c).
All events were timed and the nature and timing of unexpected events (e.g. spooking, head up) were recorded (CC). Rider position and straightness were assessed by a BHS Instructor (A.B.). Saddle movement was defined on a binary (yes/no) scale as mild left/right oscillation, severe left/right oscillation, saddle consistently slipping to one side (mild/severe) and/or bouncing.
Physiological assessments
For each test, equine temperature, pulse and respiratory rates were recorded pre‐ and post‐exercise, with continuous monitoring of heart rate
6
Polar ProTrainer 5, Polar, Kempele, Finland. during exercise. Base line, pre‐ and post‐exercise saliva samples were collected for measurement of cortisol concentration (Roberts et al. ).
The response to palpation (muscle tension and pain) of the thoracolumbar region was determined pre‐exercise and immediately post‐exercise (Quiney et al.). Thoracic dimensions were measured at predetermined sites pre‐ and immediately post‐exercise. Data for all these measurements are reported separately (Quiney et al. ; Roberts et al. ).
Test abandonment
For welfare reasons, there were predefined criteria for test abandonment: (i). Development of lameness grade ≥3/8 in one limb or grade ≥2 in ≥2 limbs; (ii). Display of ≥10/24 behavioural markers of pain (e.g. ears back, constant moving of head, tail lashing, reluctance to go forwards willingly; Supplementary Item ; Dyson et al. 2017, 2018b).
Test abandonment was signified by blowing of a whistle, at which point the horse was stopped immediately and the rider dismounted. If a test was abandoned, the horse was reassessed by S.D. trotting in hand on the arena surface 45–60 min after termination of the test.
Test order
The horse:rider test order was randomised whilst ensuring that each horse's test times were distributed between morning and afternoon sessions in a ratio of 4:2, or, for one horse, 3:3. Each horse was to be ridden once by riders L and H and twice by riders M and VH.
However, the protocol was amended on the third study day when, unexpectedly, all H and VH rider trials had been abandoned before test completion. Therefore, the VH rider's test was only repeated in one horse and no H rider repeats were conducted. Instead, the L and M riders' tests were repeated for all horses. This change in protocol necessitated alteration of the test order.
For the first two study days, horses were randomly assigned to morning exercise slots. The following days' test orders were changed to an imbalanced Latin square design in order to ensure the following: (i). Each horse was ridden once/day for 4 days and twice on 1 day; (ii) If a horse was ridden twice/day, one rider was always L and there were at least 3 h between tests; (iii) Riders rode no more than three times/day and had at least 1 h between tests.
Data analysis
Within this paper, most data presentation is descriptive. The riders' body mass index (BMI) (NIH 2018) and rider:horse bodyweight percentages were calculated.
In order to compare subjective observation lameness scores (1 = lame, 0 = nonlame) for each limb with IMU (poll and pelvis) data for each horse:rider test, IMU asymmetry for the pretest trot and for the trots prior to the first canter of the test on the left and right reins were scored as either 1 (asymmetry exceeds published thresholds for nonlame horses;
Starke et al. 2012b; Pfau et al. 2013, based on Buchner et al. 1996; Greve and Dyson 2016; Greve 2016) or 0 (asymmetry does not exceed that found in nonlame horses).
If the IMU data indicated asymmetry, direction of asymmetry was determined. We calculated the percentage of horse:rider tests in which agreement was achieved between the subjective and IMU lameness assessments in terms of both presence/absence of lameness and, if lame, the identity of the lame limb.
Gait analysis data were analysed for normal distribution (Kolmogorov Smirnoff). Only trot data up to the first canter (the point that most tests reached before abandonment) were used for analysis.
Saddle fit was unequal among riders and there was a smaller number of tests for riders H and VH, therefore multiple one‐way ANOVA's were used to test for the fixed effect of rider using the trial mean data per horse. Data were therefore treated as unrelated/independent and a between‐group test was chosen.
To analyse for extent of asymmetry statistically, data were transformed to positive deviations (nondirectional) from baseline, but actual symmetry with untransformed data are presented in the figures. Tests for rider VH were abandoned earliest, and IMU data were predominantly from riding on the left rein in straight lines. Therefore, mAnova was used, with a Bonferroni post hoc test, to assess for minimum and maximum differences according to riders for all horses at Poll, Withers and Pelvis for trot in straight lines on the left rein only.
An additional test was carried out for straight lines and circles on both reins to test for differences among L, M and H riders. A Spearman rank correlation was also performed, to test asymmetry according to rider, for all measures in trot in a straight line, on the left rein. The significance was set at P<0.05. The Statistical package of IBM SPSS 23 (2017)
7
IBM Corporation, Armonk, New York, USA. was used.
Results
The weather was cool (13–19°C) over the 5‐day test period.
Dimensions of the horses' usual riders
The horses' usual riders had estimated bodyweights of 61–92 kg and rider:horse bodyweight percentages and BMIs of 10.9–17.4 (mean, 13.0; median, 12.5) and 21.1–37.3 kg/m2 respectively.
Dimensions of the horses and test riders
Horses ranged in height from 150.0 to 165.0 cm (mean, 157.3 cm; median, 157.0 cm) and in bodyweight for the 6 days of investigation from 507 to 591 kg (mean, 555 kg; median, 528–546 kg). There was variation in bodyweight within normal variance (−14 kg to +1 kg) between the day of admission and the final test day. BCS was estimated as 5.5–8.0 (mode, 5.5). Horses 3 and 5 had increased to BCS of 8.0 and 7.5, respectively, since selection for the study.
Forelimb dimensions and thoracolumbar region length are summarised in Supplementary Item . Muscle development of the cervical, thoracolumbosacral and pelvic regions was subjectively considered moderate in all horses (Walker et al. ).
The mean and range of bodyweight of each rider over the test period was: L, 60.8 (60.0–61.5) kg; M, 77.8 (77.0–79.0) kg; H, 91.0 (90.0–92.0) kg; and VH, 142.1 (141.5–143.0) kg. Each horse's saddle plus pads and numnah weighed 7.5–11.0 kg (mean, 9.7 kg; median, 9.0–10.0 kg) and the force mat weighed 2.0 kg.
Table summarises the rider and rider‐plus‐tack weights as a percentage of horse bodyweight and Table 2 shows rider height and body proportions. Rider BMI for the L, M, H and VH riders was, respectively, 23.2, 28.0, 26.3 and 46.9 kg/m2 (Table ).
| Horse | L | M | H | VH | ||||
|---|---|---|---|---|---|---|---|---|
| Rider | Rider + tack | Rider | Rider + tack | Rider | Rider + tack | Rider | Rider + tack | |
| 1 | 11.7 | 13.8 | 15.0 | 16.9 | 17.9 | 20.0 | 27.5 | 29.7 |
| 2 | 11.4 | 13.5 | 14.6 | 16.7 | 17.4 | 19.5 | 26.8 | 28.9 |
| 3 | 10.8 | 13.2 | 13.9 | 16.3 | 16.6 | 19.0 | 25.5 | 27.9 |
| 4 | 10.0 | 12.2 | 12.8 | 15.0 | 15.3 | 17.5 | 23.6 | 25.8 |
| 5 | 11.4 | 13.6 | 14.6 | 16.9 | 17.4 | 19.7 | 26.8 | 29.1 |
| 6 | 10.2 | 11.8 | 13.1 | 14.7 | 15.6 | 17.3 | 24.1 | 25.7 |
- L, light; M, moderate; H, heavy; VH, very heavy.
| Rider | Height | Upper body length: humeral tubercle to tuber coxae | Leg length: tuber coxae to lateral malleolus of tibia | Mean weight | BMI* BMI categories: Underweight <18.5 kg/m2, Normal weight = 18.5–24.9 kg/m2, Overweight = 25–29.9 kg/m2, Obese ≥30 kg/m2. | ||
|---|---|---|---|---|---|---|---|
| Left | Right | Left | Right | ||||
| L | 162.0 | 42.5 | 43.0 | 89.0 | 91.0 | 60.8 | 23.2 |
| M | 167.0 | 41.0 | 41.0 | 96.0 | 99.0 | 77.8 | 28.0 |
| H | 185.5 | 46.0 | 45.5 | 105.5 | 101.0 | 91.0 | 26.3 |
| VH | 174.0 | 50.0 | 49.0 | 97.0 | 95.0 | 142.1 | 46.9 |
- * BMI categories: Underweight <18.5 kg/m2, Normal weight = 18.5–24.9 kg/m2, Overweight = 25–29.9 kg/m2, Obese ≥30 kg/m2.
Saddle fit to horses and riders: subjective observations
All saddles were general‐purpose type. No saddle fitted the horses ideally, despite recent fitting (within 3 months) by professional saddle fitters (Horses 1 and 4), and adjustments made by C.M.
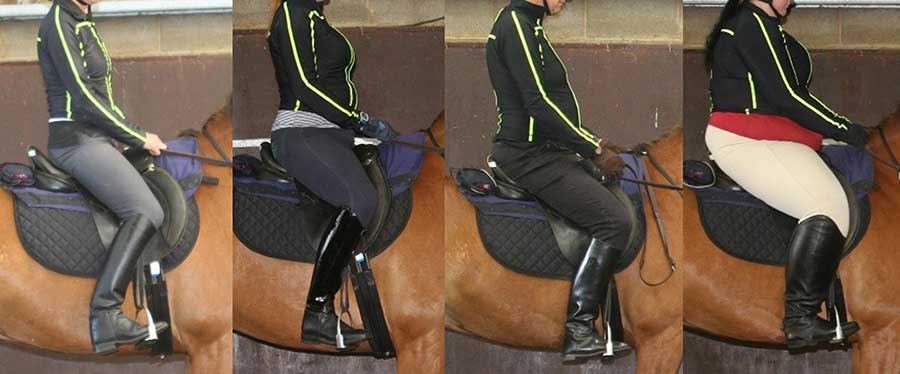
Saddle length was appropriate for riders L and M for all horses, and for rider H for Horse 1 only (Table 3; Figs 1 and 2). Rider H sat on the cantle of the saddle for Horses 2–6. The VH rider's seat extended caudal to the cantle on all horses. Vertical alignment of the riders' shoulders, tubera coxae (‘hips') and heels was assessed from lateral photographs, which were acquired with the horses stationary. Vertical alignment was present for rider L on all horses, and for rider M on Horses 2–5.
In all other horse‐rider combinations (rider M on Horses 1 and 6, riders H and VH on all horses), the rider's shoulders, ‘hips' and heels were not in vertical alignment. This persisted for rider VH during motion; the position of rider H varied according to gait. Detailed analysis of rider position during the tests will be reported separately.
| Horse | Rider | Length of saddle seat relative to rider size | Rider's shoulder, tuber coxae and heel in vertical alignment |
|---|---|---|---|
| 1 | L | Correct | Yes |
| M | Correct | No | |
| H | Correct | No | |
| VH | Very short | No | |
| 2 | L | Correct | Yes |
| M | Correct | Yes | |
| H | Short | No | |
| VH | Very short | No | |
| 3 | L | Correct | Yes |
| M | Correct | Yes | |
| H | Short | No | |
| VH | Very short | No | |
| 4 | L | Correct | Yes |
| M | Correct | Yes | |
| H | Short | No | |
| VH | Very short | No | |
| 5 | L | Correct | Yes |
| M | Correct | Yes | |
| H | Short | No | |
| VH | Very short | No | |
| 6 | L | Correct | Yes |
| M | Correct | No | |
| H | Short | No | |
| VH | Very short | No |
- Correct, rider sitting in the centre of the saddle with clearance behind and in front. Short, rider sitting on back of cantle. Very short, rider's seat extends beyond the cantle. The alignment of the rider's shoulder, tuber coxae (‘hip') and heel was assessed with the horse stationary.
, Moderate (M), Heavy (H) and Very Heavy (VH) stationary on Horse 2.
</p>
<p>The seat of the saddle is of correct length for riders L and M, is short for rider H, who is sitting on the back of the cantle, and is very short for rider VH, whose seat extends beyond the cantle. There is lack of vertical alignment of the shoulder, tuber coxae (‘hip') and heel for riders H and VH.")
The seat of the saddle is of correct length for riders L and M, is short for rider H, who is sitting on the back of the cantle, and is very short for rider VH, whose seat extends beyond the cantle. There is lack of vertical alignment of the shoulder, tuber coxae (‘hip') and heel for riders H and VH.
, Moderate (M), Heavy (H) and Very Heavy (VH) on Horse 2.")
Saddle movement
Mild side‐to‐side oscillation of the saddle in trot was observed with the VH, H, M and L riders in 14.3, 50.0, 76.9 and 84.6% of their tests respectively. Severe oscillation was not documented. The caudal aspect of the saddle did not bounce with rider VH, but did with the other riders on Horses 1, 2, 4 and 5.
When considering all riders, severe saddle slip to the right occurred in Horses 3 and 5 in trot and canter in 85.7 and 83.3% of tests respectively; mild saddle slip to the right also occurred in Horses 1 and 6 and to the left in Horse 4, particularly associated with crookedness in canter, in 71.4, 75.7 and 16.7% of these horses' tests respectively. Horse 4 had saddle slip to the right in trot with rider H.
Gait and behaviour: subjective observations
The following lamenesses were exhibited during one pretest trot up only: Horse 1, grade 1 left hindlimb; Horse 3, grade 1 right hindlimb; Horse 4, grade 1 right hindlimb; Horse 5, grade 1 right hindlimb.
On two separate occasions, Horse 6 exhibited, respectively, a grade 1 right forelimb lameness and a grade 1 left hindlimb lameness. On all other occasions, the horses showed no detectable lameness on pretest trot up.
No horse showed detectable extension of the thoracolumbosacral region when mounted or when moving off at the walk. Observations of lameness grade ≤2 during the test are summarised in Table 4. Low‐grade lameness was seen in horses ridden by riders L and M, but was inconsistently present within and among tests.
Going above the bit in transitions to canter, crookedness in canter and spontaneous change in gait from canter to trot were observed with all riders, not necessarily associated with overt lameness at the trot. Frequency of occurrence could not be compared among all riders because riders H and VH did not complete the tests.
| Horse | Rider | Reason for abandonment | Saddle slip direction | Lameness observations with other riders |
|---|---|---|---|---|
| 1 | VH | Lame LH 4/8 1st trot left rein | Right |
L rider: grade 1 LH M rider: grade 1 RH |
| H | 10/24 behavioural markers in canter | Right | ||
| 2 | H | Lame RH 3/8 2nd trot left rein |
L rider: grade 2 LF L and M riders: grade 1 and 2 RH respectively H rider: grade 1 LF |
|
| VH | Lame LF 3/8 and RH 4/8 1st trot right rein | |||
| 3 | VH | Lame LH 4/8 1st trot left rein | Right | L rider: grade 2 LH |
| M | Lame LH 3/8 1st trot left rein | Right | ||
| H | Lame LH 4/8 1st trot left rein | Right | ||
| 4 | VH | Lame LH 4/8 1st trot left rein | ||
| H | Lame LF 3/8 1st trot right rein | Right | ||
| 5 | H | Lame RF 3/8 and LH 2/8 1st trot right rein | Right | |
| VH | Lame LF 4/8 1st trot left rein | |||
| 6 | VH | Lame LH 4/8 2nd trot left rein | Right | |
| VH | Lame RF 3/8 and LH 3/8 1st trot left rein | |||
| H | Lame 3/8 LH 1st trot left rein | Right |
-
The data are shown in the order in which each horse was ridden by the respective riders. The mean time to abandonment was 16.6 min (range 9.0–25.2) for rider H and 8.3 min (range 6.0–19.0) for rider VH. Lameness observations for other tests and saddle slip presence are also summarised. LF, left front; RF, right front; LH, left hind; RH, right hind.
Lameness was graded 0–8 (Dyson 2011). The lameness observations for riders L and M were only observed in one of the two tests for each horse.
All rider VH tests (n = 7) were abandoned because of lameness (Table 4). Five rider H tests were abandoned for lameness and one was stopped because the horse demonstrated 10/24 behavioural markers in canter. One rider M:Horse 3 test was abandoned because of lameness; however, the second rider M:Horse 3 test was completed.
Although the test was abandoned three times for Horses 3 and 6 and twice for Horses 1, 2, 4 and 5, only in Horses 2, 3 and 6 was the same lame limb identified on ≥2 occasions. When reassessed subjectively moving in hand at trot 45–60 min after test abandonment, no horse showed detectable lameness.
All horses moved as well or better when ridden by riders L and M at the end of the study compared with the beginning, when evaluated both subjectively and objectively. Horses 3 and 4 successfully completed a test with rider L later on the same day as an abandonment.
Objective gait analysis
For the pretest trot up, the mean ± s.d. (range, mm) for all horses and all tests combined was 2.4 ± 2.7 (0, 8) for absolute PollMnD, 0.05 ± 2.8 (0, 9) for PollMxD, 3.11 ± 4.8 (0, 14) for PMnD, 2.2 ± 4.8 (0, 15) for PMxD and 4.3 ± 6.0 (0, 18) for HHD.
During ridden exercise, the IMU data varied considerably among horses, with no consistent patterns across all horses (Fig 3). However, the magnitude of asymmetry or variability in asymmetry appeared greater for the heavier riders on the left or the right rein, depending on the horse.
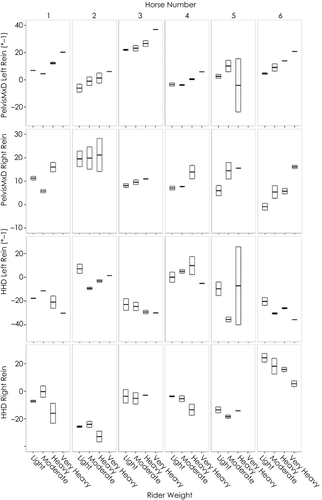
These box and whisker plots show the median (solid line) and interquartile range (box) which includes 50% of the values, and maximum and minimum values (=whiskers), excluding outliers.
Comparison of subjective lameness analysis and objective gait analysis
Comparison of the subjective lameness scoring for each limb (lame or nonlame and direction of asymmetry) for each horse and rider with lameness scores derived from IMU data resulted in a 100% agreement for lameness/nonlameness seen at trot pretest and during the test in all horses for each rider.
Figure 4 shows a clear example of the IMU data for HHD in trot on a straight line, highlighting the much greater asymmetry values for the heavier riders according to horse.

Comparison of IMU data among riders
Figure 5 highlights overall differences in IMU data among riders. Statistical analysis was limited because of the early test abandonments for riders H and VH. For trotting on the right rein on the straight, horses ridden by rider H had a significantly higher level of asymmetry than for riders M and L for PMxD (F = 7, P<0.01, mAnova, Bonferroni, excluding rider VH). Horses ridden by rider VH had a trend towards a higher HHD (hip hike difference) on the left circle (P = 0.08, F = 2.3).

Superscripts not shared among riders within a row indicate significant differences for that measure between riders (P < 0.05, mAnova).
When ridden on the left rein there was sufficient data to look at correlations among all riders and transformed differences measuring extent of asymmetry.
This highlighted a significant positive correlation between riders' bodyweight and amount of asymmetry for PelvisMxD (P<0.05, R2 = 0.4) and HHD (P<0.01, R2 = 0.4; Spearman Rank; Fig 6).

Data are shown for hip hike difference (HHD, open circles and grey bars) and for pelvis maximum difference (PMxD, black circles and bars) and show the correlation with the rider bodyweights (HHD, P<0.01, R2 = 0.4; PMxD, P<0.05, R2 = 0.4).
Discussion
We have documented a substantial temporary adverse effect of rider on gait and behaviour, with no test being completed by the H or VH riders. The two factors that are most likely to underlie this finding are: (i) rider weight as a proportion of horse weight; (ii) rider position in the saddle/on the horse's back (which is a function of rider size).
The design of this pilot study does not allow us to determine which of these two factors is most influential or whether, indeed, both are important. In terms of rider weight, our results suggest that rider BMI, per se, is not a key factor: both the M and H riders were classified as overweight, based on BMI; however, rider M completed 11 out of 12 tests whereas rider H did not complete any of their six tests.
Saddle fit for the rider may affect the horse's ability to move comfortably (Greve and Dyson 2013b). For Horse 2, the owner and rider H had identical rider:horse bodyweight percentages (17.4) and similar weights (92 and 91 kg respectively), but different heights (157.0 and 185.5 cm respectively).
This large difference in height has major potential implications for saddle fit for the rider and consequently for the rider's position and weight distribution (Schleese 2014; Dyson et al. 2015).
However, when considering rider height, leg length vs. upper body length must also be considered. Although riders H and VH were the tallest of the four riders, rider M had similar leg length to rider VH (Table 2).
The different body proportions of the four riders suggest that a range of saddles would have been required for each horse if optimum rider saddle fit was to be maintained. However, we deliberately elected not to use different saddles for each rider because this would have introduced another variable factor.
Moreover, the use of rider‐specific saddles would not mimic the situation which occurs in many riding schools, where usually each horse has one saddle, nor the situation at competitions when a pony may be ridden‐in by an adult before being ridden by a child. In addition, in the current study, saddles that were sufficiently large for rider VH would have extended beyond the eighteenth thoracic vertebra in all the horses.
It has been generally accepted that a tree should not extend beyond the eighteenth thoracic vertebra (Harman 2005; Schleese 2014), although there is a growing opinion which needs scientific validation, that to extend to the second lumbar vertebra may be acceptable.
With custom‐designed saddles, the seat of the saddle may be manufactured to extend beyond the length of the tree, allowing a large rider to sit more centrally in the seat of the saddle.
In the current study, all trot was performed ‘rising'. Using objective gait assessment, there are detectable differences in hindlimb movement symmetry in horses ridden in rising trot compared with sitting trot, in both straight lines and circles (Persson‐Sjodin et al. 2018) and, in rising trot, in circles compared with straight lines (Robartes et al. 2013).
We mandated the use of rising trot in our study because: (i) the horses were not used to being ridden continuously in sitting trot and the riders did not ride daily for long periods in sitting trot; (ii) the majority of riders in English saddles (except dressage riders) ride predominantly in rising trot.
Moreover, the purpose of the study was to determine if there were consistent measurable differences in equine gait among the riders; mandating that all riders sat on the same diagonal reduced the potential for inconsistencies among riders.
The study design tested each horse's ability to perform a 30‐min test, predominantly at trot and canter, which their owners were confident they would be able to achieve. However, the high BCS of Horses 3 and 5 (8.0 and 7.5 respectively) could have influenced their performance.
Retrospectively, fitness for the work performed was considered adequate for Horses 1, 2, 4 and 6 and borderline for Horses 3 and 5. Nonetheless, Horses 3 and 5 were able to complete a test with riders L or M on the same day on which a test was abandoned and recovery data did not differ among horses (full results reported separately).
The BCS of Horses 3 and 5 had increased in the 6 weeks' interval since selection for the study. Had Horses 3 and 5 been of a lower BCS, the rider:horse bodyweight ratios for these horses would have been higher. Owners, however, should be dissuaded from increasing horse bodyweight to reduce rider:horse bodyweight ratios.
In previous studies that demonstrated changes in gait in association with additional weight (Matsuura et al. 2013a,2013b, 2016; Gunnarsson et al. 2017), the weight difference was achieved using a single experienced rider with added lead weights, rather than riders of different weights.
Cross spectrum analysis of accelerometer data acquired from horses' chests was used to assess gait symmetry and stability of rhythm in Japanese native horses (mean bodyweight, 340 kg) and Taishuh ponies (mean bodyweight, 232 kg) carrying total loads of 80–130 kg (24–38% of bodyweight) and 70–120 kg (30–52% of bodyweight) respectively (Matsuura et al. 2013a,2013b).
The test took place at walk and trot only, over a short distance (40 m). In the Japanese native horses, trot symmetry at 100 kg was less than at 80 kg and it was concluded that the maximum permissible load should be <100 kg (i.e. <29% of horse bodyweight).
In the Taishuh ponies, gait rhythm slowed with heavier weights and it was concluded that the maximum permissible load should be ≤100 kg (i.e. ≤43% of horse bodyweight). These studies, performed over very short periods, assume that gait symmetry and rhythm would not alter over longer periods of work with these weight ratios.
In contrast, our data showed major gait asymmetries, especially with rider VH, despite substantially lower load:horse bodyweight ratios, possibly reflecting the distribution of the load or the longer duration of exercise.
In a study of eight Icelandic horses carrying 20, 25, 30 and 35% of their own bodyweight (single professional rider‐plus‐lead) at the tölt, kinematics were measured using a high‐speed camera in an incremental exercise test (5 × 642 m; Gunnarsson et al. 2017).
Although, in contrast to the current study, there were no measurable changes in rhythm or symmetry, increasing weight was associated with decreased stride length and increased stride frequency and duty factor in all limbs, factors not assessed in our study.
In the current study, we observed lameness in most of the horses when being ridden, which had not been apparent in hand, as has previously been documented (Dyson and Greve 2016).
However, when present, lameness was usually low‐grade (≤grade 2/8) and transient with the lighter riders (L, M) and was deemed acceptable for continued work.
We also observed some variations in lameness induction among the different riders with respect to limb and grade; however, the heavier riders (H, VH) consistently induced more severe lameness than the lighter riders (L, M). This may be influenced by the fit of the saddle to the rider and by resultant differences in weight distribution.
There is limited information about the influence of different riders riding the same horse in succession. The effect of a novice rider versus an experienced dressage rider of similar bodyweight (65 kg) was compared in sitting trot on lame horses; there was an increase in hindlimb lameness with the dressage rider (Licka et al. 2004), perhaps because the more skilled rider asked for increased engagement of the hindlimbs.
Forelimb or hindlimb lameness that was apparent in hand altered with a rider in an unpredictable way, sometimes becoming unapparent (Licka et al. 2004).
In the current study, low‐grade lameness that was apparent in hand was not necessarily detectable when ridden. Moreover, the more severe lameness induced by the H and VH riders was temporary:
lameness which developed during the test had resolved when assessed in hand within 45–60 min of test abandonment and all horses finished the study moving as well or better when ridden than they had begun, assessed both subjectively and objectively.
Rider ability was standardised according to published definitions (Williams and Tabor 2017).
We do not believe that a horse's behaviour as assessed using the ridden horse ethogram will alter with an unfamiliar, skilled rider; the test riders were more highly skilled than the horses' normal riders.
The ridden horse ethogram was retrospectively applied to video recordings of predetermined sections of every test; the total scores were significantly higher for rider VH vs. all other riders, and for rider H vs. rider M (Dyson et al. 2018c).
In the current study, both subjectively and objectively determined gait asymmetry were influenced by the biomechanical effects of a change in load. As discussed above, further investigation is required to determine whether magnitude of load, load distribution (data to be reported in a separate publication), or both were the primary drivers of increased gait asymmetry.
The adverse effects of the change in loading were particularly apparent with rider VH. A variety of studies have assessed the biomechanical effects of loading that may potentially influence lameness development. The effect of a 75 kg load (de Cocq et al. 2004) or a rider (Schamhardt et al. 1991;
Clayton et al. 1999) on the gait of nonlame horses was investigated kinematically on a treadmill (de Cocq et al. 2004) and overground (Schamhardt et al. 1991; Clayton et al. 1999).
Extension of the thoracolumbar region increased at walk, trot and canter with a rider compared with nonridden, although thoracolumbar range of movement did not change and there were no major changes in limb kinematics (de Cocq et al. 2004).
However, there was greater extension of the metacarpophalangeal joints in trot in ridden compared with nonridden horses (Clayton et al. 1999).
The presence of a rider increased ground reaction forces (GRFs) more in forelimbs than in hindlimbs, although a rider resulted in alteration of the centre of mass towards the hindlimbs compared with a static load of the same weight (Schamhardt et al. 1991). This highlights the importance of conducting weight‐carrying investigations with riders rather than dead weights.
We chose riders of different weights, rather than adding static load, because this is a more realistic representation of what happens when riders of varying size ride horses. Force is the product of mass and acceleration and heavier riders will therefore be associated with larger forces.
In addition, with a larger rider, the forces are unlikely to be ideally distributed because the saddle may not fit the rider.
This mimics what happens in some branches of equestrianism (e.g. riding schools, trekking centres, adults riding children's ponies). The position of a rider is affected by many factors, including the saddle seat length, the position of the stirrup bars, the size and shape of the saddle flaps and the position and size of knee rolls and thigh blocks (Harman 2005; Schleese 2014).
Rider position and thus force distribution will also be influenced by the rider's core strength, limb muscle strength and coordination and balance (Peham et al. 2001, 2004; Lagarde et al. 2005; Bogisch et al. 2014), features that were not assessed in the current study.
Rider position when horses are stationary may change when the horse is in motion (Meyners 2004); detailed analysis of rider position during the tests is reported separately.
If riders cannot sit in a balanced position with their shoulder, ‘hip' and heel consistently in vertical alignment (as in this study for riders H and VH [Fig 1]) and in the correct place relative to the horse's centre of gravity, this has implications for both rider balance and force distribution.
Moreover, if large riders ride relatively small horses, it may not be possible to find a saddle that has sufficient seat length for the rider, a tree that does not extend beyond the eighteenth thoracic vertebra (Harman 2005; Schleese 2014) and that allows the rider to be positioned correctly and as close as possible to the horse's centre of gravity.
The seat of the VH rider extended beyond the cantle of the saddle in all horses and none of the horses could have accommodated a saddle of longer length. Custom‐made saddles can be manufactured with a standard tree length but longer panels and seat, to accommodate larger riders.
Using such a saddle with a larger horse, it should have been possible to achieve adequate saddle fit for the VH rider.
There is a positive relationship between speed and the forces between the rider, saddle and horse (Peham et al. 2010). With increased speed at trot, peak forces increase in association with increased vertical oscillation of the equine thoracolumbar region, higher GRFs and decreased range of motion of the thoracolumbar region.
Increased load results in increased extension of the thoracolumbar region in walk, trot and canter (de Cocq et al. 2004).
In the current study, no horse reached the criteria for abandonment in walk, but rider H was stopped in the first trot phase in four tests, the second trot phase in one test and in the first canter on Horse 1. The tests for the VH rider were abandoned six times in the first trot phase and once in the second trot phase. If a horse is only worked at walk it may be reasonable that it carries a heavier weight than if worked at faster gaits.
The abandonment criteria were predefined to protect the horses' welfare and of necessity were subjective to provide rapid decisions. It had not been anticipated that such a high proportion of the tests for riders H and VH would be terminated. The assessor could not be blinded and there is a clear potential for bias.
However, each lameness was clear to see for all observers (equine veterinarians), and all subjective lameness‐based test abandonment decisions were verified by retrospective analysis of IMU data.
In terms of the subjectivity of the real‐time assessment of behaviour, the ability of a trained assessor to accurately identify behaviour in real time is supported by comparison of real‐time findings and retrospective analysis of video recordings (Dyson et al. 2019).
A high proportion of ill‐fitting saddles in the general horse population has been reported previously (Greve and Dyson 2014, 2015). In the current study, despite attempts to improve the fit of owners' tack prior to the study, saddle fit to the horse was not perfect, but was considered adequate for the purposes of the investigation.
Although previous work shows that ill‐fitting saddles have the potential to adversely affect force distribution and magnitude (de Cocq et al. 2006; Meschan et al. 2007;
Kotschwar et al. 2010; von Peinen et al. 2010) and equine performance (Greve et al. 2015), the horses performed satisfactorily with riders L and M.
There were recurrent problems with saddle slip to the right in Horses 3 and 5, both of which had a recent increase in BCS. Horse 3's tests were abandoned for left hindlimb lameness on three occasions and this horse showed consistently measurable asymmetry in push‐off of the hindlimbs.
The presence of subclinical lameness, combined with a round back shape at the level of the thirteenth and eighteenth thoracic vertebrae associated with a high BCS, were likely contributing factors (Greve and Dyson 2013a; Greve and Dyson 2014).
In future studies, we recommend the use of a panel of professional saddle fitters to facilitate ideal saddle fit.
The Horse 1:rider H test was abandoned because the horse displayed 10 behavioural markers of pain. We have previously demonstrated that the display of ≥8 of 24 behavioural markers is likely to reflect the presence of musculoskeletal pain (Dyson and Van Dijk 2018;
For the purpose of test abandonment in the current study, we used a cut‐off of ≥10 of 24 behavioural markers. The application of the ethogram in real time may result in underscoring, because some features (e.g. eye closure) may be more difficult to determine than during assessment of video recordings.
Detailed analysis of the behaviour of all horses throughout the study will be reported separately, as will data on salivary cortisol concentrations, pulse and respiratory rates, blink rate, forces under the saddle, thoracic dimensions and response to thoracolumbar palpation.
There are anecdotal suggestions that horses with greater circumference of the metacarpal region (i.e. more ‘bone') are capable of carrying more weight than horses with less ‘bone'.
In a study of eight unfit horses ridden by one of three experienced riders plus lead (total weight, 15, 20, 25 and 30% of horse bodyweight), metacarpal region circumference was negatively associated with muscle soreness and tightness after a 45‐min exercise test (Powell et al. 2008). However, this study was of low power and therefore the conclusions are questionable.
In the current study, Horse 5 had a metacarpal circumference of 29 cm which was larger than all the others (19–23 cm); however, all horses failed to complete the test with riders H and VH. No conclusions can be drawn without a study of sufficient power specifically designed to investigate the influence of metacarpal region circumference on load‐carrying capacity.
The results of our study are not necessarily applicable to lower level activity (e.g. hacking at the walk) compared with the 30‐min test predominantly in trot and canter, nor to more fit animals, nor those that have been slowly adapted to weight‐carrying.
It has been suggested that fit, appropriately conditioned Arab endurance horses are able to carry 20–30% of their body weight for 100 miles (Garlinghouse and Burill 1999).
Similarly, the results of the current study cannot necessarily be transferred to more intense work (e.g. working at faster speeds, on undulating terrain or jumping), or work of longer duration.
In conclusion, we have clearly demonstrated deleterious effects of inappropriate rider size on equine gait and behaviour. The results suggest that any adverse influence of less than ideally fitting tack for horse or rider may be accentuated by riders who are heavier and/or taller.
The results of this study do not mean that heavy or tall riders should not ride, but suggest that, if they do, they should ride a horse of appropriate size and fitness, with a saddle that is correctly fitted for both horse and rider.
Further work is, however, required to determine if horse fitness, greater metacarpal region circumference, breed, adaptation to heavier weights and more ideal saddle fit will increase the weight that individual horses can carry.
Authors' declaration of interests
No conflicts of interest have been declared.
Sources of funding
The study was generously supported by World Horse Welfare, the Saddle Research Trust, Frank Dyson, British Equestrian Federation, British Horse Society, Pony Club, Polocross UK, The Showing Council, The Showing Register, The Society of Master Saddlers, Riding for the Disabled, British Eventing, British Dressage, the British Horse Foundation, the Worshipful Company of Saddlers and Endurance GB.
Acknowledgements
Karen Allott, Siobhan Gilligan, Karen Sweet and Tony Tyler rode the horses. Melissa Lockwood, Catherine Morris, Thilo Pfau, Laura Quiney, Linda Roost, Emily Sparkes, Heather Stephenson, and Rebecca Young contributed to data collection. Diane Fisher, Elizabeth Leggett and Sue Norton, Society of Master Saddlers qualified saddle fitters, contributed to the saddle fitting.
Centaur Biomechanics provided jackets for the riders. British Eventing provided timing clocks. British Equestrian Federation provided heart rate monitors. Norfolk Weights and Measures calibrated the scales.
Authorship
The idea for the study was conceived by S. Dyson and P. Harris. The study was designed by S. Dyson, P. Harris, A. Ellis, J. Douglas and A. Bondi, and was performed by all authors. Statistical analysis was performed by A. Ellis. The subjective data were interpreted by S. Dyson and P. Harris. S. Dyson, P. Harris and J. Douglas wrote the paper, which was approved by all authors.
This article originally appeared on Wiley Online Library and is published here with permission.
Find our more about this and other important topics in our section on Health & Education.
Are you interested in promoting your business or sharing content on EIE? Contact us at info@equineinfoexchange.com